Tuesday, March 26, 2013

Thematic Map


http://mapsof.net/map/philippine-climate-map#.UVIsgRxgTX4
Thematic maps can be used for a large variety of reasons. Thematic maps use visualization techniques to make an information variable easier to understand. They simply take that information- on any topic or from any study- and represent it on a map. This thematic map shows the differing climate types of the Philippines. The colors are used to differentiate between the types, from wet half of the year and dry the other half (in blue) to rainfall of even distribution throughout the whole year (in yellow). 

Dot Density Map

http://flatrock.org.nz/topics/new_jersey/where_do_they_live_and_what_do_they_do.htm
This is a dot density map of New Jersey representing the population and where they resided in 1990. Dot density maps are used to show the distribution of a certain variable throughout an area. On this map, each dot represents 500 people, so the areas on the map where there is a thick density of dots represent the most popular areas to live: the most populated areas here were near New York City, Philadelphia, Trenton, and Seaside. I live just west of Seaside and can honestly say that even still today, 23 years later, this trend lasts.

Topographic Map

http://geology.isu.edu/geostac/Field_Exercise/wildfire/topography.htm

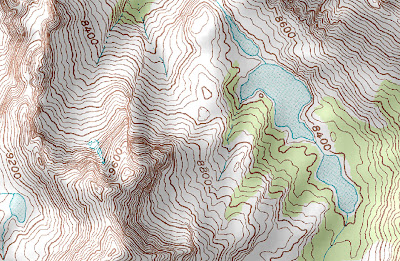
Unlike a planimetric map, topographic maps are very useful for seeing elevational differences between two spots on the same map. That is just what these maps are for: topographic maps use contour lines as well as three-dimensional shading relief to show the elevation of geographic features. This map, where elevation exceeds 9600 ft, is directly from a web article about topography and its use in cartography. Here we can not only see where there are hills or mountains from the look of raised features but also from the contour lines.


Friday, March 22, 2013

Planimetric Map

http://www.orangesmile.com/travelguide/florence/city-maps.htm

This is a road map of Florence, Italy. It is a planimetric map because it only shows the area and the places in the city horizontally; meaning there is no third dimensional aspect showing elevation or some particular landforms. For example, someone looking at this map would not be able to tell that the green area at the bottom of this map is very hilly/ mountainous. When you are at Piazzale Michealangelo, noted by the little red dot located in the middle of this green, you are atop the mountain and have a very clear view of all the city. Just looking at the map, you might not know it unless you know the area. 

Wednesday, March 20, 2013

Mental Map

http://georeferenced.wordpress.com/2010/06/08/forget-the-geoweb-%E2%80%93-let-children-map-our-world/

This map was on display at the "Magnificent Maps" exhibition at the British Library in London, which was closed in September of 2010. It is a mental map of the cartographer's own mind. Mental maps are maps that are thought up and projected in one's own mind. A child's drawing, or that of someone with a child-like mental ability, of an area they know is a perfect example of this. Young or unable to yet see the technicalities and ordered ways of geographically mapping out the world, they present an image of the world from their own pure thoughts and experiences. For example, in this map a plane does not represent an airport, it represents the way to Grandma's because the cartographer of this map relates going to the airport to going to visit their grandmother. The same could be said for the river: this artist does not "travel to the river", they simply "go swimming" at that location.